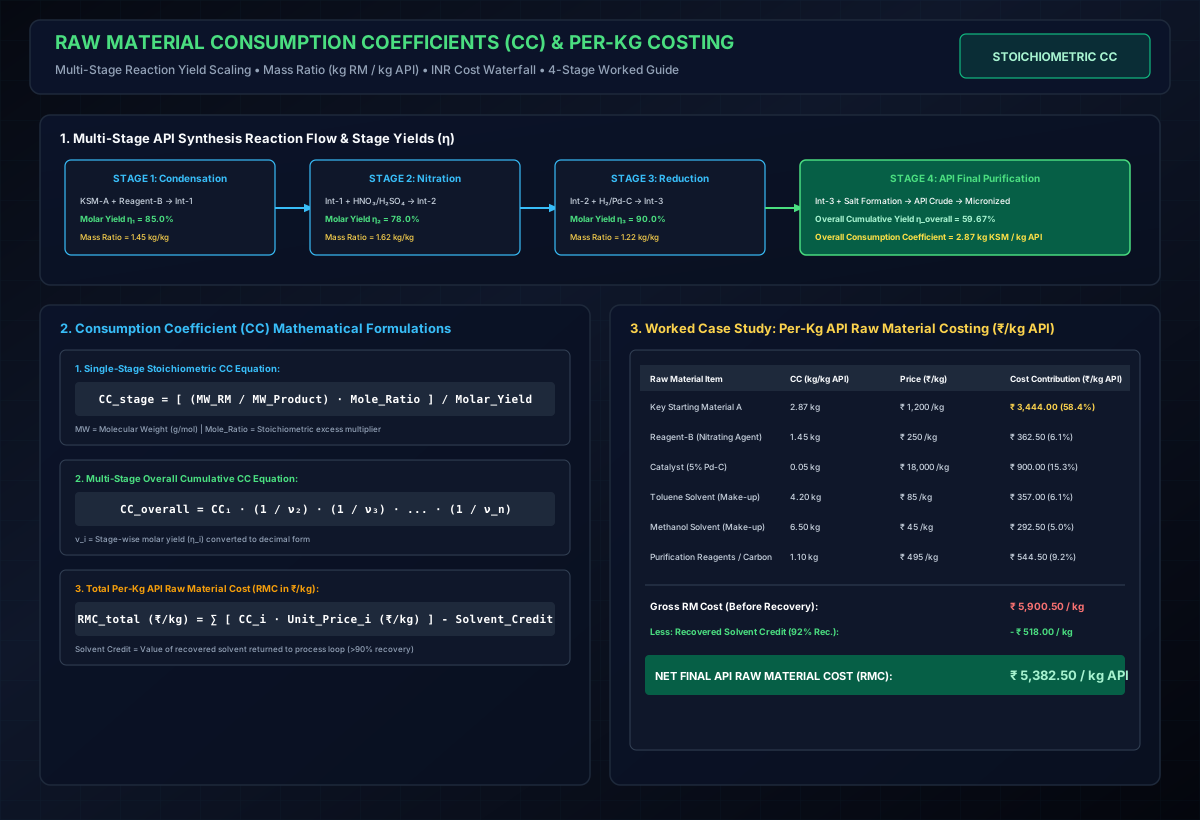
# How to Calculate Raw Material Consumption Coefficients (CC) & Per-Kg Costing Across Multi-Stage API Synthesis: A 4-Stage Worked Guide
# Executive Summary & Engineering Scope
In active pharmaceutical ingredient (API) chemical development, pilot plant scale-up, and commercial operations, Raw Material Consumption Coefficients (CC) and Cost Coefficients are the fundamental metrics used by process engineers, tech transfer teams, and commercial finance to establish product cost structures.
A Consumption Coefficient (CC) represents the exact mass or volume of a raw material, reagent, or solvent consumed to produce 1.0 kg of an intermediate or final API product:
In multi-stage batch organic synthesis (e.g., Stage-1 Stage-2 Stage-3 Final API), calculating raw material costs is not a simple linear sum. Because yields cascade multiplicatively across stages, a 1.0% yield loss in Stage-1 consumes significantly more raw materials than a 1.0% yield loss in the Final API stage.
  CASCADING YIELD EFFECT ACROSS 4-STAGE API SYNTHESIS

  Stage-1 (Yield 88%) ──► Stage-2 (Yield 85%) ──► Stage-3 (Yield 90%) ──► Final API (Yield 92%)

  Overall Process Yield = 0.88 × 0.85 × 0.90 × 0.92 = 62.0% Overall Conversion
  * 1.0 kg KSM-1 in Stage-1 requires 1.648 kg of KSM-1 per kg of Final API output!
This comprehensive engineering masterclass provides:
- First-Principles Equations for Stage-wise CC, Cumulative CC, and Yield Cascading.
- Solvent Recovery Credit Accounting (Distillation efficiency, net makeup CC vs gross charge CC).
- A Complete Worked 4-Stage API Commercial Case Study detailing Stage-1, Stage-2, Stage-3, and Final API batch balances in Indian Rupees (₹/kg API).
- Yield Sensitivity Index (YSI) Analysis demonstrating where yield optimization generates maximum financial leverage.
- Standard Costing Template & Audit Checklist for Process Engineers.
# 1. Mathematical Principles of Consumption & Cost Coefficients
# 1.1 Definitions & Basic Formulas
# 1. Gross Stage Consumption Coefficient ()
The ratio of total raw material or solvent charged into the reactor to the isolated product mass of that specific stage:
Where:
- = Mass of raw material charged in Stage (kg).
- = Mass of isolated product obtained in Stage (kg).
# 2. Net Solvent Consumption Coefficient ()
In commercial API manufacturing, solvents are recovered via batch or continuous distillation and re-used. The net consumption coefficient accounts for fresh solvent makeup required after recovery:
Where is the fractional solvent recovery efficiency (e.g., to ).
# 3. Cumulative Raw Material Consumption Coefficient ()
To determine how many kilograms of a Stage-1 Key Starting Material (KSM) are required to produce 1.0 kg of Final API, multiply the individual stage consumption coefficients:
Or expressed via Stage Molar/Mass Yields ():
# 1.2 The Yield Cascading Multiplier Rule
If a 4-stage process has stage yields of , the overall process yield is:
Engineering Key Takeaway: A 1% yield improvement in Stage-1 saves times more starting material cost across the entire supply chain than a 1% improvement in Stage-4!
# 2. Worked 4-Stage API Case Study: Per-Kg Costing in INR (₹)
Consider a commercial API synthesis manufacturing campaign producing 1,000 kg batches of an Active Pharmaceutical Ingredient across 4 synthetic stages:
  ┌───────────────┐     ┌───────────────┐     ┌───────────────┐     ┌───────────────┐
  │   STAGE-1     │     │   STAGE-2     │     │   STAGE-3     │     │  FINAL API    │
  │ Coupling Rxn  ├──►  │ Nucleophilic  ├──►  │ Catalytic     ├──►  │ Salt Form &   │
  │  (INT-1)      │     │ Subst (INT-2) │     │ Hydrog(INT-3) │     │ Micronization │
  └───────┬───────┘     └───────┬───────┘     └───────┬───────┘     └───────┬───────┘
          │                     │                     │                     │
      Yield: 88.0%          Yield: 85.0%          Yield: 90.0%          Yield: 92.1%
# 2.1 Stage-1: Synthesis of Intermediate-1 (INT-1)
# Batch Mass Balance (1,000 kg Batch of INT-1):
- Key Starting Material (KSM-A): charged.
- Reagent-1 (Thionyl Chloride): charged.
- Solvent-1 (Toluene): () charged.
- Process Water & Caustic Lye (30% NaOH): charged.
- Isolated INT-1 Output: (Stage Yield ).
- Solvent Recovery: of Toluene recovered (), net fresh makeup required .
# Stage-1 Consumption Coefficients & Costing Table:
| Input Material | Category | Qty Charged (kg or L) | Unit Price (₹/unit) | Total Charge Cost (₹) | Recovery Credit (₹) | Net Cost (₹) | Stage CC (kg/kg INT-1) | Cost Contribution (₹/kg INT-1) |
|---|---|---|---|---|---|---|---|---|
| KSM-A | Key Raw Material | ₹ 450 / kg | ₹ 5,40,000 | -- | ₹ 5,40,000 | 1.200 | ₹ 540.00 | |
| Reagent-1 () | Reagent | ₹ 120 / kg | ₹ 54,000 | -- | ₹ 54,000 | 0.450 | ₹ 54.00 | |
| Toluene | Solvent | () | ₹ 85 / kg | ₹ 2,57,550 | ₹ 1,86,620 (88% Rec @ ₹ 70) | ₹ 70,930 | 0.364 (Net) | ₹ 70.93 |
| Caustic Lye (30%) | Utility Base | ₹ 35 / kg | ₹ 21,000 | -- | ₹ 21,000 | 0.600 | ₹ 21.00 | |
| STAGE-1 TOTAL | -- | -- | -- | ₹ 8,72,550 | ₹ 1,86,620 | ₹ 6,85,930 | -- | ₹ 685.93 / kg INT-1 |
# 2.2 Stage-2: Nucleophilic Substitution to Intermediate-2 (INT-2)
# Batch Mass Balance (1,000 kg Batch of INT-2):
- Intermediate-1 (INT-1): charged (@ ₹ 685.93/kg).
- Reagent-2 (Substituted Amine): charged.
- Solvent-2 (Dichloromethane DCM): () charged.
- Phase Transfer Catalyst (TBAB): charged.
- Isolated INT-2 Output: (Stage Yield ).
- Solvent Recovery: of DCM recovered (), net fresh makeup required .
# Stage-2 Consumption Coefficients & Costing Table:
| Input Material | Category | Qty Charged (kg or L) | Unit Price (₹/unit) | Total Charge Cost (₹) | Recovery Credit (₹) | Net Cost (₹) | Stage CC (kg/kg INT-2) | Cost Contribution (₹/kg INT-2) |
|---|---|---|---|---|---|---|---|---|
| INT-1 (from Stage-1) | Intermediate | ₹ 685.93 / kg | ₹ 7,88,820 | -- | ₹ 7,88,820 | 1.150 | ₹ 788.82 | |
| Reagent-2 (Amine) | Reagent | ₹ 850 / kg | ₹ 2,72,000 | -- | ₹ 2,72,000 | 0.320 | ₹ 272.00 | |
| DCM | Solvent | () | ₹ 75 / kg | ₹ 4,18,950 | ₹ 3,01,620 (90% Rec @ ₹ 60) | ₹ 1,17,330 | 0.559 (Net) | ₹ 117.33 |
| TBAB Catalyst | Catalyst | ₹ 650 / kg | ₹ 16,250 | -- | ₹ 16,250 | 0.025 | ₹ 16.25 | |
| STAGE-2 TOTAL | -- | -- | -- | ₹ 14,96,020 | ₹ 3,01,620 | ₹ 11,94,400 | -- | ₹ 1,194.40 / kg INT-2 |
# 2.3 Stage-3: Catalytic Hydrogenation to Intermediate-3 (INT-3)
# Batch Mass Balance (1,000 kg Batch of INT-3):
- Intermediate-2 (INT-2): charged (@ ₹ 1,194.40/kg).
- Solvent-3 (Methanol MeOH): () charged.
- Hydrogen Gas (): charged.
- Precious Metal Catalyst ( wet): charged. Spent cake sent for metal refining credit ( recovery credit).
- Isolated INT-3 Output: (Stage Yield ).
- Solvent Recovery: of Methanol recovered (), net fresh makeup .
# Stage-3 Consumption Coefficients & Costing Table:
| Input Material | Category | Qty Charged (kg or L) | Unit Price (₹/unit) | Total Charge Cost (₹) | Recovery Credit (₹) | Net Cost (₹) | Stage CC (kg/kg INT-3) | Cost Contribution (₹/kg INT-3) |
|---|---|---|---|---|---|---|---|---|
| INT-2 (from Stage-2) | Intermediate | ₹ 1,194.40 / kg | ₹ 13,13,840 | -- | ₹ 13,13,840 | 1.100 | ₹ 1,313.84 | |
| Methanol (MeOH) | Solvent | () | ₹ 45 / kg | ₹ 1,35,090 | ₹ 99,432 (92% Rec @ ₹ 36) | ₹ 35,658 | 0.240 (Net) | ₹ 35.66 |
| Hydrogen Gas () | Utility Gas | ₹ 150 / | ₹ 12,000 | -- | ₹ 12,000 | 0.080 | ₹ 12.00 | |
| Pd/C 5% Catalyst | Noble Catalyst | ₹ 38,000 / kg gross | ₹ 13,30,000 | ₹ 11,45,000 (98% Pd Refine) | ₹ 1,85,000 | 0.035 (Gross) | ₹ 185.00 | |
| STAGE-3 TOTAL | -- | -- | -- | ₹ 27,90,930 | ₹ 12,44,432 | ₹ 15,46,498 | -- | ₹ 1,546.50 / kg INT-3 |
# 2.4 Stage-4 (Final API Stage): Deprotection, Salt Formation, Recrystallization & Micronization
# Batch Mass Balance (1,000 kg Batch of Pure API):
- Intermediate-3 (INT-3): charged (@ ₹ 1,546.50/kg).
- Methanesulfonic Acid (MSA): charged.
- Solvent-4 (Isopropanol IPA): () charged.
- Antisolvent (Purified Water): charged.
- Activated Carbon (Norit): charged.
- Micronization Nitrogen Gas: charged.
- Isolated Final Pure API Output: (Stage Yield ).
- Solvent Recovery: of IPA recovered (), net fresh makeup .
# Final API Stage-4 Consumption Coefficients & Costing Table:
| Input Material | Category | Qty Charged (kg or L) | Unit Price (₹/unit) | Total Charge Cost (₹) | Recovery Credit (₹) | Net Cost (₹) | Stage CC (kg/kg API) | Cost Contribution (₹/kg API) |
|---|---|---|---|---|---|---|---|---|
| INT-3 (from Stage-3) | Intermediate | ₹ 1,546.50 / kg | ₹ 16,77,953 | -- | ₹ 16,77,953 | 1.085 | ₹ 1,677.95 | |
| MSA Acid | Reagent / Salt | ₹ 280 / kg | ₹ 50,400 | -- | ₹ 50,400 | 0.180 | ₹ 50.40 | |
| Isopropanol (IPA) | Solvent | () | ₹ 95 / kg | ₹ 3,35,540 | ₹ 2,50,692 (91% Rec @ ₹ 78) | ₹ 84,848 | 0.318 (Net) | ₹ 84.85 |
| Purified Water | Utility Solvent | ₹ 2.00 / L | ₹ 3,000 | -- | ₹ 3,000 | 1.500 | ₹ 3.00 | |
| Activated Carbon | Processing Aid | ₹ 180 / kg | ₹ 3,600 | -- | ₹ 3,600 | 0.020 | ₹ 3.60 | |
| Nitrogen Gas | Utility Gas | ₹ 18 / | ₹ 2,700 | -- | ₹ 2,700 | 0.150 | ₹ 2.70 | |
| FINAL API TOTAL | -- | -- | -- | ₹ 20,73,193 | ₹ 2,50,692 | ₹ 18,22,501 | -- | ₹ 1,822.50 / kg API |
# 3. Overall Cumulative Consumption Coefficients & Master Cost Roll-Up
Below is the master engineering summary rolling up every raw material from Stage-1 to Final API on a Per-Kg of Final API basis:
  MASTER CUMULATIVE ROLL-UP FOR 1.0 KG OF FINAL API

  KSM-A (Stage-1) ──────────► 1.648 kg / kg API ──────────► ₹ 741.60 / kg API
  SOCl2 (Stage-1) ──────────► 0.619 kg / kg API ──────────► ₹ 74.28 / kg API
  Amine Reg (Stage-2) ──────► 0.407 kg / kg API ──────────► ₹ 345.95 / kg API
  Pd/C Catalyst (Stage-3) ──► 0.038 kg / kg API ──────────► ₹ 201.78 / kg API (Net)
  MSA Acid (Stage-4) ───────► 0.180 kg / kg API ──────────► ₹ 50.40 / kg API
  Net Solvents Makeup ──────► 1.450 kg / kg API ──────────► ₹ 408.49 / kg API
  Utilities & Carbon ───────► Various ───────────────────► ₹ 9.30 / kg API
  ─────────────────────────────────────────────────────────────────────────────
  TOTAL FINAL API RAW MATERIAL COST                      = ₹ 1,822.50 / kg API
# Cumulative CC & Cost Contribution Breakdown Table (Per Kg Final API):
| Input Material | Origin Stage | Individual Stage CC | Cumulative Multiplier () | Cumulative CC (kg RM / kg Final API) | Unit Cost (₹/kg) | Cumulative Cost Contribution (₹/kg API) | % of Final API RMC |
|---|---|---|---|---|---|---|---|
| KSM-A | Stage-1 | 1.648 kg | ₹ 450.00 | ₹ 741.60 | 40.69% | ||
| Reagent-1 () | Stage-1 | 0.618 kg | ₹ 120.00 | ₹ 74.16 | 4.07% | ||
| Stage-1 Net Toluene | Stage-1 | 0.500 kg | ₹ 194.86 (Net) | ₹ 97.43 | 5.35% | ||
| Reagent-2 (Amine) | Stage-2 | 0.382 kg | ₹ 850.00 | ₹ 324.70 | 17.82% | ||
| Stage-2 Net DCM | Stage-2 | 0.667 kg | ₹ 209.89 (Net) | ₹ 140.00 | 7.68% | ||
| Pd/C Catalyst (Net) | Stage-3 | 0.038 kg | ₹ 5,285 (Net) | ₹ 200.83 | 11.02% | ||
| Stage-3 Net MeOH | Stage-3 | 0.260 kg | ₹ 148.58 (Net) | ₹ 38.63 | 2.12% | ||
| MSA Acid | Stage-4 | 0.180 kg | ₹ 280.00 | ₹ 50.40 | 2.77% | ||
| Stage-4 Net IPA | Stage-4 | 0.318 kg | ₹ 266.82 (Net) | ₹ 84.85 | 4.66% | ||
| Utilities & Carbon | All Stages | Various | Various | Various | ₹ 69.90 | 3.84% | |
| TOTAL FINAL API RMC | -- | -- | -- | -- | -- | ₹ 1,822.50 / kg | 100.00% |
# 4. Yield Sensitivity Index (YSI) Analysis
To determine where process engineering optimization yields maximum monetary return, compute the Yield Sensitivity Index (YSI) for each stage:
# YSI Comparison Across Stages:
  YIELD SENSITIVITY INDEX (YSI) - COST SAVED PER 1.0% YIELD INCREASE

  ■ Stage-1 (Yield 88% → 89%): Saves ₹ 18.42 / kg API  (Highest Leverage!)
  ■ Stage-2 (Yield 85% → 86%): Saves ₹ 14.05 / kg API
  ■ Stage-3 (Yield 90% → 91%): Saves ₹ 13.93 / kg API
  ■ Stage-4 (Yield 92.1% → 93.1%): Saves ₹ 9.21 / kg API
Process Optimization Rule: Stage-1 yield improvements deliver 2.0x higher financial savings per percentage point than Stage-4 yield improvements! Always prioritize Stage-1 and Stage-2 yield optimization during tech transfer.
# 5. Plant Process Engineer’s CC Costing Audit Checklist
Before releasing a new API manufacturing cost estimate to commercial teams:
- Verify Isolated vs Theoretical Yields: Ensure CCs are calculated on isolated dry product weight (), not wet cake or theoretical yield.
- Account for Solvent Recovery Losses: Confirm recovery efficiency () is based on actual historical plant recovery data (), not lab scale 100% assumptions.
- Include Noble Metal Refining Credits: Deduct precious metal recovery credit value from gross catalyst charges.
- Check Molar vs Mass CC: Validate molecular weight ratios across stages to ensure stoichiometric limits are obeyed.
- Audit Cascading Multipliers: Apply cumulative multipliers () to all early-stage starting materials.
- Reconcile Density Units: Convert solvent volumetric liters to mass kilograms () before multiplying by ₹/kg prices.
# 6. References & Engineering Standards
- Sinnott, R. K. & Towler, G.: Chemical Engineering Design: Principles, Practice and Economics of Plant and Process Design (6th Edition).
- ACS Green Chemistry Institute: Pharmaceutical Round Table Process Mass Intensity & Cost Tool Guide (2024).
- Azevedo, D. et al.: Techno-Economic Evaluation of Multi-Stage API Manufacturing Processes (Organic Process Research & Development).