# Continuous PAT & Real-Time Release Testing (RTRT) in Flow Skids: Sensor Fusion, Chemometrics & ICH Q13 Compliance
# Executive Summary & Regulatory Context
In traditional batch pharmaceutical manufacturing, quality assurance relies heavily on off-line quality control (QC) testing of isolated intermediates and end-product API samples. Samples are withdrawn, sent to an analytical testing laboratory, and analyzed via offline HPLC/GC. This offline paradigm introduces feedback delays ranging from hours to weeks, holds large inventory volumes in quarantine, and provides zero real-time visibility into process dynamics.
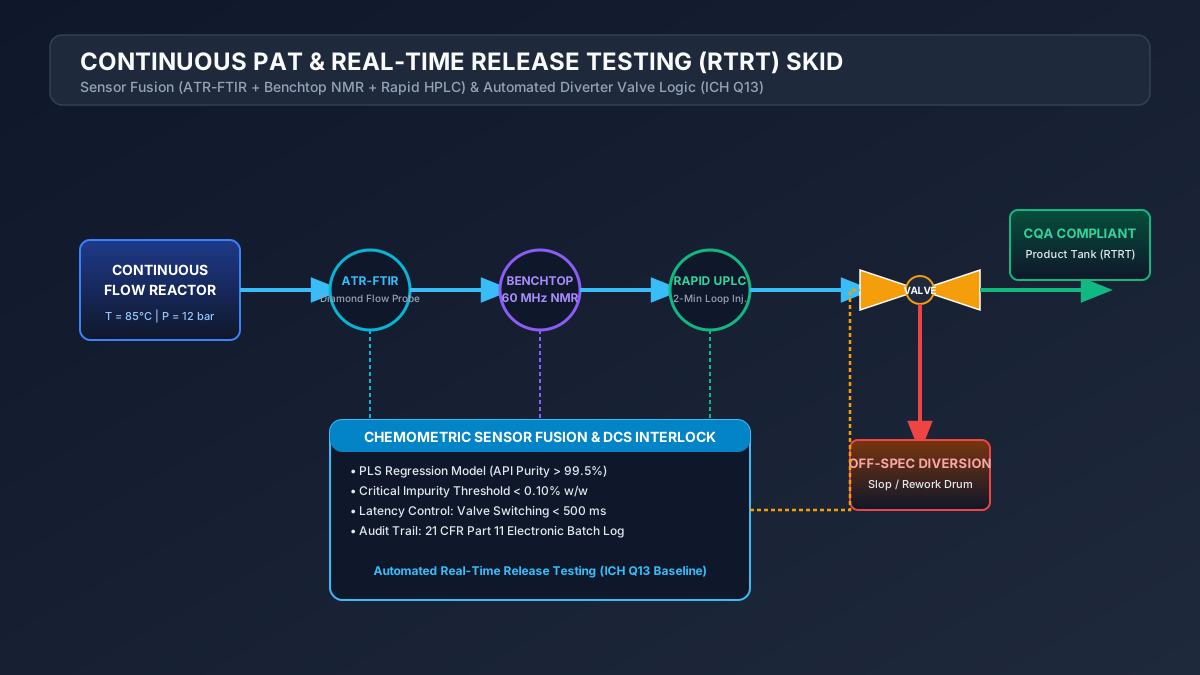
Continuous Process Analytical Technology (PAT) and Real-Time Release Testing (RTRT) transform quality assurance from reactive testing to proactive, continuous control. By embedding high-speed inline and online analytical sensors—such as Diamond Attenuated Total Reflection FTIR (ATR-FTIR), benchtop 60 MHz quantitative NMR (), and ultra-fast HPLC—directly into continuous flow skids, process engineers measure Critical Quality Attributes (CQAs) continuously at steady state.
Under ICH Q13 guidelines (Continuous Manufacturing of Drug Substances and Drug Products), a validated RTRT system combined with automated diverter valve logic allows real-time material release, bypassing traditional off-line release testing.
This guide details the optical physics, chemometric algorithms, sensor fusion architectures, and regulatory frameworks required to implement RTRT on industrial continuous flow skids.
# 1. Architectural Overview of Continuous PAT & Sensor Fusion
A continuous PAT sensor network integrates multiple orthogonal analytical detectors along the continuous flow path:
                      CONTINUOUS PAT & SENSOR FUSION SCHEMATIC
 ┌─────────────────────────────────────────────────────────────────────────────────────────────┐
 │                                                                                             │
 │  ┌──────────────┐     ┌──────────────┐     ┌──────────────┐     ┌──────────────┐            │
 │  │ Flow Reactor │────►│ PAT Node 1:  │────►│ PAT Node 2:  │────►│ PAT Node 3:  │────┐       │
 │  │ (SiC / PFR)  │     │ Diamond      │     │ Benchtop     │     │ Rapid UPLC   │    │       │
 │  │              │     │ ATR-FTIR     │     │ 60 MHz NMR   │     │ (90s Cycle)  │    │       │
 │  └──────────────┘     └──────────────┘     └──────────────┘     └──────────────┘    │       │
 │                              │                    │                    │            │       │
 │                              ▼                    ▼                    ▼            │       │
 │                       ┌────────────────────────────────────────────────┐            │       │
 │                       │ CHEMOMETRIC ENGINE & SENSOR FUSION (PLS / PCA) │            │       │
 │                       │ Calculates: Yield (%), Conversion, Impurities  │            │       │
 │                       └───────────────────────┬────────────────────────┘            │       │
 │                                               │                                     │       │
 │                                               ▼                                     ▼       │
 │                       ┌────────────────────────────────────────────────┐     ┌──────────────┐
 │                       │ DCS CONTROL & RTRT DECISION ENGINE             │────►│ 3-Way OOS    │
 │                       │ Validates Specs Against ICH Q13 Criteria       │     │ Diverter     │
 │                       └────────────────────────────────────────────────┘     └──────────────┘
 └─────────────────────────────────────────────────────────────────────────────────────────────┘
# 1.1 Comparison of Continuous PAT Technologies
PAT ANALYTICAL DETECTOR SELECTION MATRIX
┌──────────────────────┬────────────────────────┬────────────────────────┬────────────────────────┐
│ PAT Detector │ Sampling Frequency │ Limit of Detection (LOD)│ MONITORED PARAMETERS │
├──────────────────────┼────────────────────────┼────────────────────────┼────────────────────────┤
│ Diamond ATR-FTIR │ │ │ Reaction kinetics, functional group conversion│
│ Benchtop 60 MHz NMR │ │ │ Molar ratio, regioisomers, assay│
│ Rapid Inline UPLC │ │ │ Trace impurities, enantiomeric purity│
│ Transmission UV-Vis │ │ │ Chromophore concentration, dispersion│
│ Inline Raman (785 nm)│ │ │ Polymorphism, crystallization phase │
└──────────────────────┴────────────────────────┴────────────────────────┴────────────────────────┘
# 2. Optical Physics & Analytical Cell Mechanics
# 2.1 Diamond ATR-FTIR Evanescent Wave Optics
Attenuated Total Reflection FTIR utilizes a high-refractive-index diamond crystal () in contact with the liquid flow stream (). When infrared light strikes the interface at an angle , total internal reflection occurs, generating an Evanescent Wave that penetrates into the liquid stream:
                DIAMOND ATR-FTIR EVANESCENT WAVE MECHANICS
 ┌─────────────────────────────────────────────────────────────────────────┐
 │ Liquid Flow Stream (n2)                                                 │
 │ ──────────────────────~ Evanescent Wave ~───────────────────────────── │
 │ ═══════════════════════════════════════════════════════════════════════ │
 │ Diamond Crystal (n1 = 2.42)                                             │
 │      \                                                         /        │
 │       \ IR Light In (θ > θ_crit)             IR Light Out /         │
 └─────────────────────────────────────────────────────────────────────────┘
The Penetration Depth () of the evanescent wave is given by:
where:
- is IR wavelength (),
- is angle of incidence (),
- are refractive indices of diamond and liquid medium.
For typical mid-IR wavelengths (), . Because penetration depth is extremely shallow, ATR-FTIR flow cells are immune to path-length clogging and turbidity issues, making them ideal for highly concentrated API reaction streams.
# 2.2 Benchtop 60 MHz Quantitative NMR ()
Continuous benchtop NMR flow cells ( glass flow tube) utilize permanent NdFeB magnet arrays operating at ().
The mole fraction () of target API intermediate relative to starting material is determined directly from integrated proton resonance intensities () without requiring empirical calibration curves:
where and are the number of protons responsible for the respective NMR resonance peaks.
# 3. Chemometrics & Multivariate Calibration Modeling
Raw PAT spectral data (FTIR absorbance matrices or Raman spectra) contain overlapping peaks, baseline tilt, and temperature-induced scattering. Converting raw spectra into concentration estimates requires multivariate chemometric algorithms.
                  CHEMOMETRIC DATA PROCESSING PIPELINE
 ┌─────────────────────────────────────────────────────────────────────────┐
 │ 1. RAW SPECTRA  ──► 2. PREPROCESSING ──► 3. PLS MODEL ──► 4. OUTPUT     │
 │ (1000s Wavenumbers)  (SNV + 2nd Deriv)    (Y = X * B)    (Yield % & CQA)│
 └─────────────────────────────────────────────────────────────────────────┘
# 3.1 Spectral Preprocessing Protocols
- Standard Normal Variate (SNV): Eliminates baseline shifts caused by light scattering or bubble passage:
- Savitzky-Golay 2nd Derivative: Resolves overlapping absorption bands and removes constant linear baseline offsets.
# 3.2 Partial Least Squares (PLS) Regression Modeling
Partial Least Squares (PLS) decomposes both the spectral predictor matrix () and the response matrix () into latent variable factors:
where and are score matrices, and are loading matrices, and are residual error matrices.
The optimal number of latent variables () is selected using cross-validation to minimize the Root Mean Square Error of Cross-Validation ():
                 RMSECV VS. LATENT VARIABLES (LV) SELECTION
  RMSECV
    ▲
    │   \
    │    \  Overfitting Zone (High LVs)
    │     \         /
    │      \_______/   ◄ Minimum RMSECV (Optimal LVs = 4)
    └────────────────────────────────────────► Number of Latent Variables (LV)
# 3.3 Anomaly Detection: Hotelling's & -Residuals
To ensure that the PLS model is not extrapolating outside its validated calibration space, the chemometric engine computes two real-time multivariate health metrics:
- Hotelling's : Measures variation within the model space:
- -Residuals (Squared Residual Payload): Measures variation outside the model space (e.g., unexpected impurity or solvent contamination):
If either or exceeds the confidence limit, the PAT engine flags a Multivariate Anomaly, invalidating the RTRT prediction and triggering an alert.
# 4. ICH Q13 Regulatory Control Strategy & Diverter Valve Automation
Under ICH Q13, a compliant continuous manufacturing control strategy requires three distinct levels of quality control:
                 ICH Q13 THREE-LEVEL CONTROL STRATEGY
 ┌─────────────────────────────────────────────────────────────────────────┐
 │ LEVEL 1: Real-Time Automatic Feedback / Feedforward Control            │
 │ (PAT sensors adjust pump flow rates & temperatures dynamically)         │
 ├─────────────────────────────────────────────────────────────────────────┤
 │ LEVEL 2: In-Process Controls (IPC) & Out-of-Spec (OOS) Diversion       │
 │ (Automated 3-way diverter valve routes OOS material to waste tank)      │
 ├─────────────────────────────────────────────────────────────────────────┤
 │ LEVEL 3: End-Product Testing & Certificate of Analysis (CoA) Release   │
 │ (RTRT surrogate models replace offline release testing)                │
 └─────────────────────────────────────────────────────────────────────────┘
# 4.1 Out-of-Spec (OOS) Material Diversion Dynamics
When an inline PAT detector measures a CQA violation (e.g., active product purity ), the DCS system must divert the un-compliant fluid volume before it enters downstream crystallizers or collection drums.
The total volume diverted () is calculated using the Residence Time Distribution (RTD) of the system:
AUTOMATED DIVERTER VALVE TIMING DIAGRAM
┌───────────────────────────────────┬───────────────────┬───────────────────┐
│ Phase │ Duration │ System Status │
├───────────────────────────────────┼───────────────────┼───────────────────┤
│ PAT Measurement & Chemometrics │ │ CQA Breach Detected│
│ DCS Signal & Valve Actuation │ │ Diverter Valve Switched│
│ Transient Out-of-Spec Diversion │ │ Fluid Routed to Waste Tank│
│ Steady-State Re-establishment │ Stable│ Diverter Valve Reset to Main│
└───────────────────────────────────┴───────────────────┴───────────────────┘
# 5. Industrial Case Study: RTRT Deployment on a Commercial API Skid
# 5.1 System Configuration & PAT Deployment
A commercial flow skid performing a continuous reaction followed by quenching was equipped with an integrated PAT suite:
- Node 1 (Post-Reactor): Inline Diamond ATR-FTIR ( scan interval) tracking reactant consumption at .
- Node 2 (Post-Quench): Benchtop 60 MHz ( scan interval) tracking product purity and residual amine stoichiometry.
- Node 3 (Final Liquid Stream): Automated rapid UPLC ( cycle time) assaying trace regioisomer impurities.
# 5.2 Results & Commercial Benefits
COMMERCIAL RTRT VS. TRADITIONAL QC COMPARISON
┌───────────────────────────────────┬───────────────────┬───────────────────┐
│ Metric │ Traditional Offline QC│ Integrated PAT RTRT│
├───────────────────────────────────┼───────────────────┼───────────────────┤
│ Analytical Release Time │ 14 days │ Real-Time (Instant)│
│ Material Quarantined │ 500 kg API │ 0 kg │
│ Sampling Frequency │ 1 sample / batch │ 360 scans / hour │
│ Off-Spec Material Produced │ 45 kg (Whole batch)│ 1.2 kg (Diverted) │
│ Quality Assurance Cost │ 0.50 / scan │
└───────────────────────────────────┴───────────────────┴───────────────────┘
# 6. Conclusions & Roadmap for Process Engineers
Implementing Continuous PAT and Real-Time Release Testing (RTRT) transforms pharmaceutical flow manufacturing:
- Eliminates Release Testing Delays: API batches are released for packaging in real time upon completion of the flow campaign.
- Prevents Batch Loss: Automated 3-way diverter valves reject transient out-of-spec fluid within milliseconds, protecting overall product quality.
- Ensures Regulatory Compliance: Fulfills all ICH Q13 requirements for Level 1 and Level 2 process control strategies.