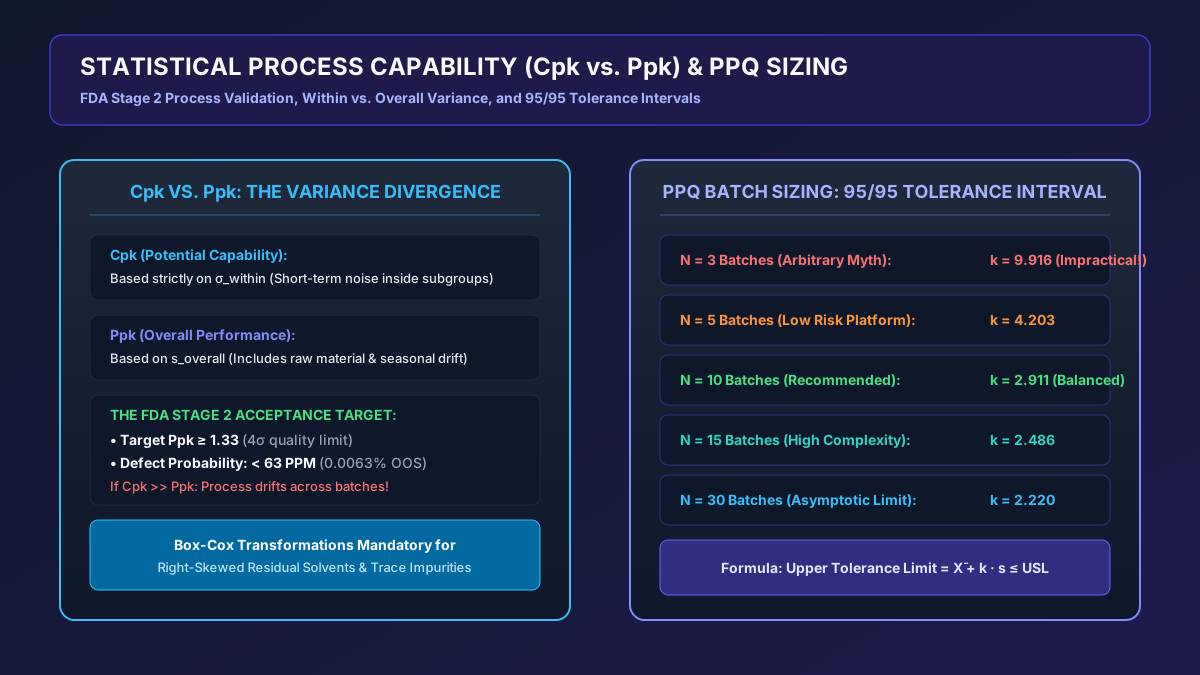
# Statistical Process Capability (, ) & PPQ Batch Sizing for Chemical Engineers (FDA Stage 2 Validation)
# A Definitive Statistical Engineering Guide on Within-Batch vs. Overall Variance ( vs. ), Non-Normal Box-Cox Transformations, and Risk-Based PPQ Batch Number Calculations
# Executive Summary & Regulatory Context
For decades in pharmaceutical commercialization, the standard validation practice was the infamous "Three-Batch Rule": execute three consecutive successful commercial batches at target setpoints, submit the batch records, and claim the process is validated.
In 2011, the US FDA Process Validation Guidance fundamentally retired this practice, replacing it with a 3-Stage Lifecycle Model:
- Stage 1 — Process Design: Defining the Design Space through Quality by Design (QbD) experiments.
- Stage 2 — Process Qualification: Confirming commercial reproducibility through Process Performance Qualification (PPQ).
- Stage 3 — Continued Process Verification (CPV): Ongoing statistical assurance of process control over commercial production.
┌──────────────────────────────────────────────────────────────────────────────────────────────────┐
│                             THE "3-BATCH MYTH" VS. FDA STAGE 2 PPQ                               │
├────────────────────────────────┬────────────────────────────────┬────────────────────────────────┤
│ Regulatory Criterion           │ Historical 3-Batch Approach    │ Modern FDA Stage 2 PPQ Metric  │
├────────────────────────────────┼────────────────────────────────┼────────────────────────────────┤
│ Batch Count Determination      │ Arbitrary rule of thumb (N = 3)│ Statistically justified (N=5-25│
│ Confidence Level               │ Unknown (< 50% statistical pow)│ 95% Confidence / 95% Coverage  │
│ Variability Assessment         │ Binary pass/fail (All in spec?)│ Quantified variance components │
│ Process Capability Index       │ Rarely calculated              │ Target Ppk ≥ 1.33 (4σ Quality) │
│ Post-Validation Expectation    │ Static, filed report           │ Live CPV Control Charts        │
└────────────────────────────────┴────────────────────────────────┴────────────────────────────────┘
Chemical engineers designing and executing technology transfer are now asked rigorous questions by regulatory auditors and QA leadership:
- "What is the statistical rationale for running PPQ batches instead of ?"
- "Why does your diverge significantly from your pilot-scale ?"
- "How do you prove process capability when residual solvents or impurity profiles follow non-normal, skewed distributions?"
This publication provides chemical and process engineers with the mathematical derivations, statistical formulas, and practical calculation protocols needed to justify PPQ batch sizing and demonstrate robust process capability ().
# 1. Mathematical Foundations: vs.
Process capability metrics quantify the relationship between the voice of the customer (specification limits: Upper Specification Limit and Lower Specification Limit ) and the voice of the process (natural statistical variation).
                      PROCESS CAPABILITY DISTRIBUTION BELL CURVE
                          Target Value (μ)
                                 │
                LSL              │              USL
                 │               ▼               │
      ───────────┼─────────────╭───╮─────────────┼───────────
                 │           ╭─╯   ╰─╮           │
                 │         ╭─╯       ╰─╮         │
                 │       ╭─╯           ╰─╮       │
                 │     ╭─╯               ╰─╮     │
                 │   ╭─╯                   ╰─╮   │
      ───────────┴───┴───────────────────────┴───┴───────────
                     ◄─────── 6σ Process ────►
# 1.1 The Crucial Distinction Between and
The mathematical formulas for Potential Capability () and Overall Performance () appear identical, but their standard deviations are calculated completely differently:
# How is Calculated:
(short-term variation) isolates inherent random noise inside individual subgroups or batches, eliminating inter-batch drift. Calculated via average subgroup range () or pooled sample variance ():
# How is Calculated:
(long-term total variation) includes raw batch-to-batch shifts, raw material lot variation, seasonal cooling water changes, and operator differences:
┌──────────────────────────────────┬──────────────────────────────────┬──────────────────────────────────┐
│ Metric Comparison                │ Cpk (Process Capability)         │ Ppk (Process Performance)        │
├──────────────────────────────────┼──────────────────────────────────┼──────────────────────────────────┤
│ Scope of Variation               │ Short-term within-batch noise    │ Long-term total observed variance│
│ Meaning of Cpk ≈ Ppk             │ Stable, homogeneous process      │ Minimal batch-to-batch shifts    │
│ Meaning of Cpk >> Ppk            │ The process is capable within a  │ Severe batch-to-batch drift! Raw │
│                                  │ batch, but drifts across batches │ materials or operations unstable │
│ FDA Regulatory Target            │ Informative (Development)        │ Mandatory for PPQ: Ppk ≥ 1.33    │
└──────────────────────────────────┴──────────────────────────────────┴────────────────────────────────┘
A process capability index of corresponds to a process spread where the specification limit is at least away from the mean. This guarantees a theoretical out-of-specification defect rate of (Parts Per Million) for single-sided limits, or .
# 2. Statistical Protocol: Sizing the Number of PPQ Batches ()
How many PPQ batches must a manufacturer run to prove reproducibility? The FDA does not prescribe a universal integer. Instead, the sample size must be justified based on statistical confidence and coverage tolerance intervals.
                SAMPLE SIZE (N) VS. TOLERANCE INTERVAL MARGIN
   K-Factor (Coverage Multiplier)
     ▲
  10 ┼
     │   N = 3 (K = 9.9) - Extreme Uncertainty!
   8 ┼   ╰───╮
     │       ╰───╮
   6 ┼           ╰──╮
     │              ╰──╮ N = 5 (K = 4.2)
   4 ┼                 ╰────╮ N = 10 (K = 2.9)
     │                      ╰─────────╮ N = 15 (K = 2.5)
   2 ┼                                ╰─────────────────────── N = 30 (K = 2.2)
   0 ┴──────────┴──────────┴──────────┴──────────┴───────────► PPQ Batch Count (N)
     0          5         10         15         20
# 2.1 The Two-Sided Statistical Tolerance Interval Method
A statistical tolerance interval guarantees with confidence (typically ) that at least a proportion (typically or ) of future commercial batches will fall within specification limits:
Where:
- = Mean of PPQ batch results
- = Sample standard deviation of PPQ batches
- = Two-sided tolerance factor (from non-central -distribution tables) based on batch count , confidence level , and coverage .
For , the tolerance factor is . That means your PPQ results must have a standard deviation so minuscule that nearly fits inside your specification limits! If , drops to ; if , stabilizes at .
# 2.2 Risk-Based Batch Number Determination Table
┌─────────────────────────┬─────────────────────────┬─────────────────────────┬─────────────────────────┐
│ Process Risk Category   │ Process Complexity &    │ Recommended PPQ Batch   │ Statistical Justification│
│                         │ Prior Platform Knowledge│ Count (N)               │ Basis                   │
├─────────────────────────┼─────────────────────────┼─────────────────────────┼─────────────────────────┤
│ Low Risk                │ High platform experience│ 3 to 5 Batches          │ High prior capability;  │
│ (Platform Technology)   │ (Established molecule)  │                         │ historical Cpk > 2.0    │
├─────────────────────────┼─────────────────────────┼─────────────────────────┼─────────────────────────┤
│ Moderate Risk           │ New chemical entity     │ 7 to 12 Batches         │ 95/90 Tolerance Interval│
│ (Standard API Scale-Up) │ (Standard reactions)    │                         │ validation              │
├─────────────────────────┼─────────────────────────┼─────────────────────────┼─────────────────────────┤
│ High Risk               │ Highly complex, sterile,│ 15 to 25 Batches        │ 95/95 Tolerance Interval│
│ (Polymorph / Narrow CQA)│ or narrow therapeutic API│                        │ with Ppk ≥ 1.33 proof   │
└─────────────────────────┴─────────────────────────┴─────────────────────────┴─────────────────────────┘
# 3. The Non-Normal Data Trap: Box-Cox & Johnson Transformations
In chemical engineering, critical attributes like residual solvent concentrations, impurity levels, and microbial counts are strictly bounded by zero (). They follow right-skewed log-normal or Weibull distributions.
Applying standard / formulas directly to skewed non-normal data produces catastrophically inaccurate capability estimates (falsely failing capable processes or masking out-of-spec tails).
                      SKEWED RESIDUAL SOLVENT DATA (RAW VS. BOX-COX)
        RAW DATA (Right-Skewed Log-Normal)             TRANSFORMED DATA (Normalized Bell Curve)
   Frequency                                      Frequency
     ▲                                              ▲
  50 ┼──█                                        25 ┼          ╭───╮
  40 ┼──██                                          ┼        ╭─╯   ╰─╮
  30 ┼──███                                         ┼      ╭─╯       ╰─╮
  20 ┼──████                                        ┼    ╭─╯           ╰─╮
  10 ┼──███████                                     ┼  ╭─╯               ╰─╮
   0 ┴──────────┴──────────► Impurity (ppm)          0 ┴───────────────────► Transformed Z
     0         500        1000                         -3    -1.5   0   +1.5  +3
# 3.1 The Box-Cox Power Transformation
The Box-Cox transformation transforms non-normal data into a normal distribution using a continuous power parameter :
# Step-by-Step Execution:
- Estimate optimal using maximum likelihood estimation across .
- Transform both raw data points () and specification limits () into transformed units ().
- Calculate mean () and standard deviation () on transformed data.
- Compute using transformed specification limits:
# 4. Worked Industrial Case Study: PPQ Campaign for API Residual Acetone
- Target CQA: Residual acetone in final crystalline API after vacuum tray drying.
- ICH Q3C Specification Limit: (). Internal Action Limit: .
- PPQ Batch Execution: full-scale commercial batches executed.
# Raw Data (10 Batches, ppm):
Batch 1: 420 | Batch 2: 580 | Batch 3: 510 | Batch 4: 790 | Batch 5: 640Batch 6: 1,120 | Batch 7: 850 | Batch 8: 710 | Batch 9: 620 | Batch 10: 940
# 4.1 Statistical Evaluation:
- Mean ():
- Sample Standard Deviation ():
- Specification Limit: (single-sided upper limit)
# 4.2 Standard Capability Calculation:
# 4.3 95% Confidence / 95% Coverage Tolerance Bound:
For , confidence, and coverage, the single-sided tolerance factor is .
Because (and well below internal action limit ), there is statistical proof with confidence that of all future commercial batches will meet residual solvent specifications. The process is successfully validated.
# 5. Key Chemical Engineering Rules of Thumb
- Retire the 3-Batch Rule: Never write a validation protocol proposing without stating that it is based on prior historical platform capability.
- Watch the Gap: If but , stop. Your within-batch controls are working, but your raw materials or drying durations are drifting across batches.
- Verify Normality Before Calculating : Always run an Anderson-Darling or Shapiro-Wilk test on CQA data. If , apply a Box-Cox transformation before calculating capability metrics.
- Transition to CPV: Validation does not end with PPQ. Feed Stage 2 data directly into Stage 3 Continued Process Verification (CPV) control charts using Shewhart and Western Electric rules.
Published by the PharmaChemEng Technical Editorial Board for pharmaceutical validation managers, technology transfer leads, and statistical process quality teams.