# Overall Equipment Effectiveness (OEE) in Pharma & Chemical Operations: 6 Big Losses, Industry Benchmarks, Worked Calculations & Plant Improvement Strategies
# Executive Summary & Technical Scope
In pharmaceutical Active Pharmaceutical Ingredient (API) manufacturing, fine chemical batch processing, and high-speed secondary packaging operations, Overall Equipment Effectiveness (OEE) is the definitive gold-standard metric for measuring equipment utilization, operational efficiency, and manufacturing productivity.
While commercial pharmaceutical facilities invest millions of dollars in ASME-certified glass-lined reactors, Agitated Nutsche Filter Dryers (ANFDs), high-speed tablet presses, and Eurovent-certified cleanroom Air Handling Units (AHUs), many plant assets operate at an actual OEE of only 45% to 65%. This represents massive hidden capacity losses caused by extended Clean-in-Place (CIP) turnarounds, unexpected equipment breakdowns, minor idling stoppages, speed reductions, and batch quality rejections.
This comprehensive chemical and industrial engineering guide covers:
- The 3 Core Pillars of OEE () with exact mathematical formulations.
- The 6 Big Losses Framework mapped specifically to batch synthesis (reactors, ANFDs) and continuous/packaging operations (tablets, blister lines).
- Two Full Worked Numerical Calculation Case Studies:
- Case Study 1: Multipurpose API Synthesis Batch Reactor Facility.
- Case Study 2: High-Speed Rotary Tablet Compression & Blister Packaging Line.
- Equipment Reliability Metrics: Mean Time Between Failures (MTBF) and Mean Time To Repair (MTTR).
- Global OEE Benchmarks: World-Class () vs. Typical Pharma Batch () vs. Bulk Chemicals ().
- 7 Actionable Plant-Floor Strategies to Improve OEE (SMED for CIP changeovers, Autonomous Maintenance, Predictive Thermal/Vibration Monitoring, PAT).
- Governing Engineering Formulas Summary Table.
- Compliance & Manufacturing Standards (FDA cGMP 21 CFR Part 211, EU GMP Annex 1, ISO 55000, OSHA PSM).
# 1. The 3 Core Pillars of OEE ()
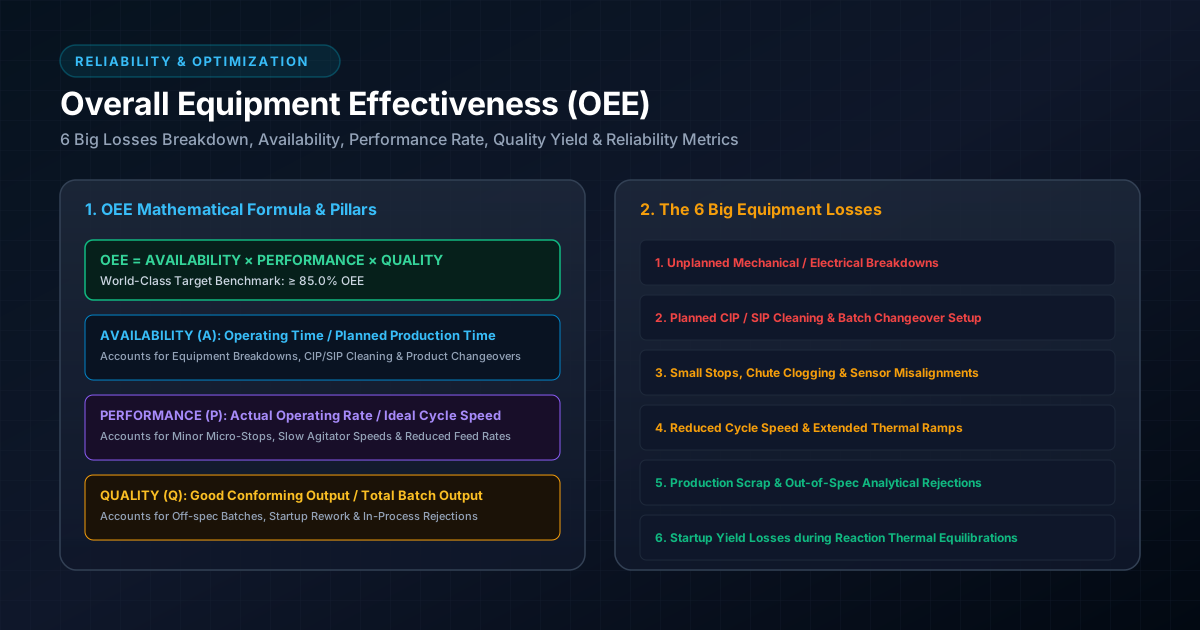
OEE quantifies how effectively a manufacturing asset is utilized relative to its designed capability during planned production hours. It is computed as the product of three distinct percentage rates:
                                  TOTAL SHIFT TIME (e.g. 24 Hours)
 ┌─────────────────────────────────────────────────────────────────────────────────────────────┐
 │  Planned Production Time (PPT)                              │ Planned Downtime (PM/CIP/Meal)│
 ├─────────────────────────────────────────────────────────────┴───────────────────────────────┤
 │  Operating Time (OT)               │ Unplanned Downtime (Breakdowns + Changeover)           │  ---> AVAILABILITY (A)
 ├────────────────────────────────────┴────────────────────────────────────────────────────────┤
 │  Net Operating Time (Ideal Speed)  │ Speed Losses & Minor Idling Stoppages                  │  ---> PERFORMANCE (P)
 ├────────────────────────────────────┴────────────────────────────────────────────────────────┤
 │  Fully Productive Time (Good Units)│ Quality Defect Scrap & Rework Loss                     │  ---> QUALITY (Q)
 └────────────────────────────────────┴────────────────────────────────────────────────────────┘
# 1.1 Availability Rate ()
Availability measures the percentage of planned production time that the equipment is actually running and available for operation:
- Planned Production Time (PPT): .
- Operating Time (OT): .
# 1.2 Performance Rate ()
Performance measures the operating speed of the asset relative to its nameplate validated design speed or ideal cycle time:
- Ideal Cycle Time (): Minimum theoretical time required to produce 1 batch or 1 unit under design conditions.
- In batch reactor operations, Performance Rate compares the actual reaction/heating cycle duration to the validated standard baseline cycle time.
# 1.3 Quality Rate ()
Quality measures the proportion of output that meets quality specifications on the first pass (First Time Right - FTR):
- Total Good Output: .
# 2. The 6 Big Losses Framework in Pharma & Chemical Plants
To systematically improve OEE, equipment losses are categorized into the 6 Big Losses:
| OEE Pillar | Loss Category | Pharma API Batch Example | Secondary Packaging Example |
|---|---|---|---|
| Availability | 1. Unplanned Breakdowns | Mechanical seal leakage, glass-lining failure, agitator motor trip, vacuum pump seizure. | Carton feeder jam, blister sealer heating element failure, conveyor drive motor fault. |
| Availability | 2. Setup & Changeovers | Solvent boil-out, CIP thermal wash, line clearance, pressure testing, product-to-product changeover. | Die changeover, tablet feeder tooling replacement, blister foil roll loading & optical alignment. |
| Performance | 3. Minor Stoppages & Idling | Temporary nitrogen pressure dip, raw material charging delay, waiting for QC sample approval. | Sensor misfires, tablet chute obstruction, temporary bottle backup on turn table. |
| Performance | 4. Reduced Operating Speed | Reduced jacket heating rate due to fouled PHE, slower agitation to prevent foaming, reduced feed rate. | Running tablet compression press at rated speed due to capping/friability issues. |
| Quality | 5. Process Defects & Off-Spec | Out-of-spec impurity profile, unreacted intermediate requiring re-crystallization, contaminated batch. | Broken/chipped tablets, pinholes in blister foil, incorrect weight variation. |
| Quality | 6. Startup & Yield Losses | Initial heel discharge loss, line priming residue in piping, warm-up solvent purge discard. | Initial 500 tablets discarded during press startup for weight adjustment. |
# 3. Worked Numerical Calculation Case Studies
# Case Study 1: Multipurpose API Batch Reactor Line
# Plant Scenario Data:
A Glass-Lined Steel (MSGL) Jacketed Reactor operates on a -hour continuous daily schedule ().
- Planned Downtime: (Scheduled preventive maintenance & shift safety handover).
- Unplanned Downtime Events:
- Agitator Mechanical Seal Flush Leak: .
- Vacuum Line Clogging & Filter Replacement: .
- Batch Setup & CIP Changeover: for solvent wash & pressure hold test.
- Production Record:
- Completed Batches Produced: .
- Validated Standard Cycle Time: .
- Quality Record: passed QA specifications on first pass; required re-distillation rework due to high moisture.
- Number of Unplanned Failure Events: .
# Step-by-Step Mathematical Solution:
# Step 1: Calculate Availability Rate ()
# Step 2: Calculate Performance Rate ()
# Step 3: Calculate Quality Rate ()
# Step 4: Calculate Overall OEE Score
Result Interpretation: The reactor OEE is , placing it in the typical batch pharma range (), but significantly below the World-Class benchmark ().
# Step 5: Calculate Reliability Metrics (MTBF & MTTR)
# Case Study 2: High-Speed Rotary Tablet Compression Line
# Line Scenario Data:
- Shift Time: ().
- Planned Meal & Teabreaks: .
- Unplanned Jams & Tooling Adjustments: .
- Batch Line Clearance & Punch Setup: .
- Nameplate Press Speed: ( or ).
- Total Tablets Produced: .
- Rejected / Scrap Tablets (Friability & Weight Variation): .
# Mathematical Solution:
- Planned Production Time (PPT): .
- Operating Time (OT): .
- Availability Rate (): .
- Ideal Operating Time: .
- Performance Rate (): .
- Quality Rate (): .
- Overall OEE:
# 4. Global OEE Industry Benchmarks
| OEE Metric | World-Class Target | Typical Batch Pharma API | Bulk Chemical Processing | Secondary Packaging |
|---|---|---|---|---|
| Availability (A) | ||||
| Performance (P) | ||||
| Quality (Q) | ||||
| OVERALL OEE |
# 5. 7 Actionable Plant Strategies to Increase OEE
# 1. Implement SMED for CIP & Changeovers
Single-Minute Exchange of Die (SMED) separates Internal Setup (tasks done while reactor/line is stopped) from External Setup (tasks prepared while previous batch is running). Pre-staging CIP solvent drums, pre-heating hot water loops, and utilizing quick-connect sanitary tri-clamp fittings reduces reactor changeover time by .
# 2. Autonomous Maintenance (AM) Checklist Implementation
Empower operators to perform daily cleaning, lubrication, inspection, and tightening (CLIT). Operator-led inspections detect minor oil leaks, loose flange bolts, and worn agitator belts before catastrophic equipment breakdown occurs.
# 3. Predictive Maintenance (PdM) via Vibration & Infrared Monitoring
Install online tri-axial vibration sensors on reactor gearboxes, centrifuges, and vacuum pumps. Infrared thermography on motor control centers (MCC) and pump bearings identifies thermal hotspots, allowing maintenance to schedule repairs during planned outages rather than suffering unexpected trips.
# 4. Process Analytical Technology (PAT) & Automated Data Logging
Replace manual paper log sheets with automated SCADA/PLC trend monitoring. In-line NIR spectroscopy, turbidity probes, and automated pH controllers eliminate waiting for manual QC lab approval, reducing batch idle time by .
# 5. Root Cause Analysis (5 Whys & Fishbone Diagram)
Conduct formal root-cause investigations for recurring minor stoppages (e.g. tablet chute jam, pump cavitation). Fixing root causes prevents compounding losses.
# 6. Heat Transfer Loop Optimization
Descale shell-and-tube heat exchangers and clean reactor jackets regularly. Fouled thermal surfaces increase batch heating/cooling times, directly lowering the Performance Rate ().
# 7. Standardized Batch Operating Procedures (SOPs)
Standardize raw material charging sequences, filter cake washing cycles, and transfer operations to eliminate inter-operator variability across shifts.
# 6. Summary Table of Governing OEE Equations
| Parameter | Symbol | Engineering Formula | Units |
|---|---|---|---|
| Planned Production Time | or | ||
| Operating Time | or | ||
| Availability Rate | |||
| Performance Rate | |||
| Quality Rate | |||
| Overall OEE | |||
| Mean Time Between Failures | |||
| Mean Time To Repair |
# 7. Governing Regulatory & Quality Standards
- FDA cGMP 21 CFR Part 211.67: Equipment maintenance and cleaning protocols for pharmaceutical production.
- EU GMP Annex 1: Qualification and operational effectiveness of sterile processing equipment.
- ISO 55000 / 55001: International standard for Asset Management & Reliability Optimization.
- OSHA PSM 29 CFR 1910.119: Mechanical Integrity (MI) requirements for process pressure vessels and relief systems.